Skogaryd
Htm_cc last 72 hours
Rum last 72 hours
Sko_cc last 72 hours
-
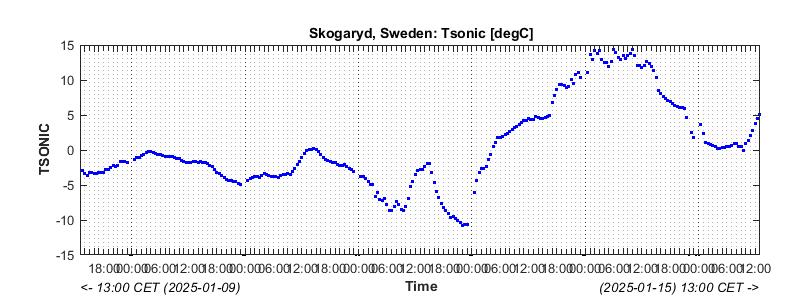
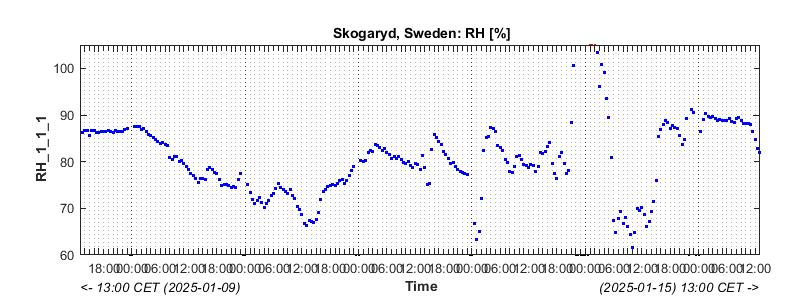
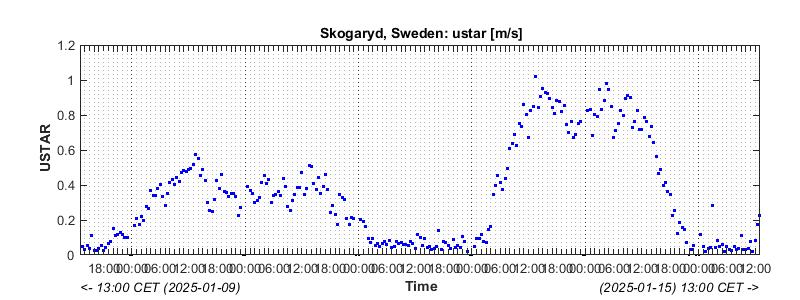
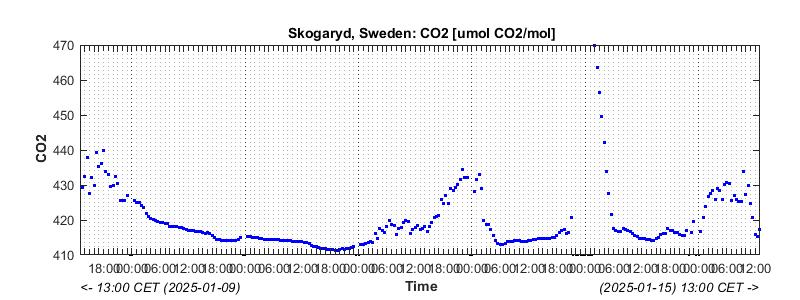
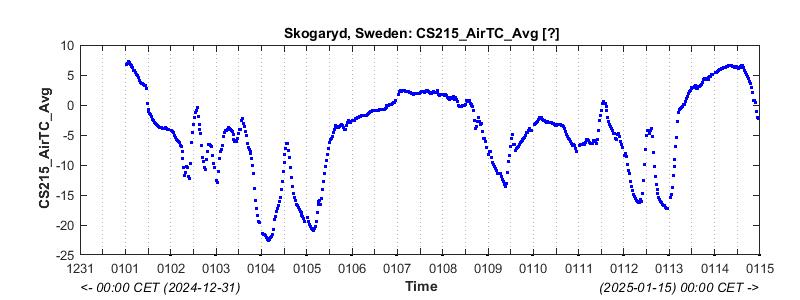
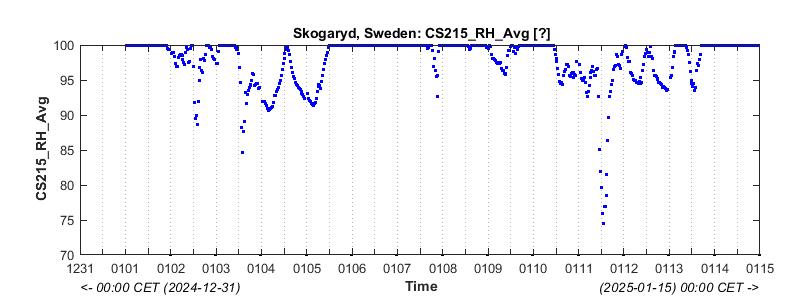
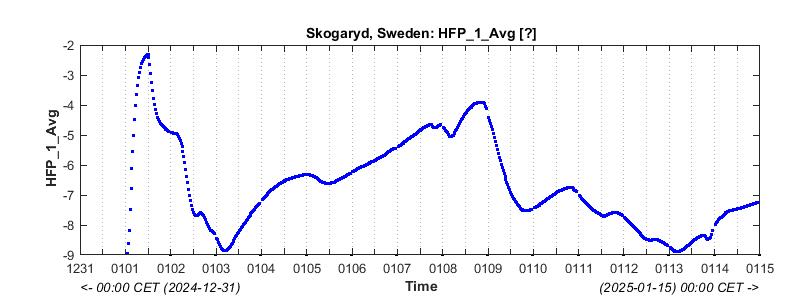
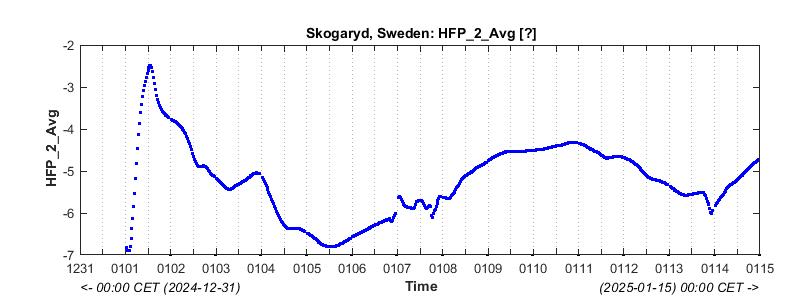
In the plots below green markers indicate
data underflow, red markers indicate
data overflow,
and black markers indicate
"missing" data values. All other data points are
blue.
-
Tickmarks along the x-axis are placed at every full hour on the dates covered by the
graphs.
-
The labelled x-axis tickmarks represent the start of 12-hour intervals.
CPEC system
old mast


